
Live Chat Software by Kayako |
|
Chart section on MT4 iphone platform
Posted by Lydia .A on 16 December 2015 02:24 PM
|
|
|
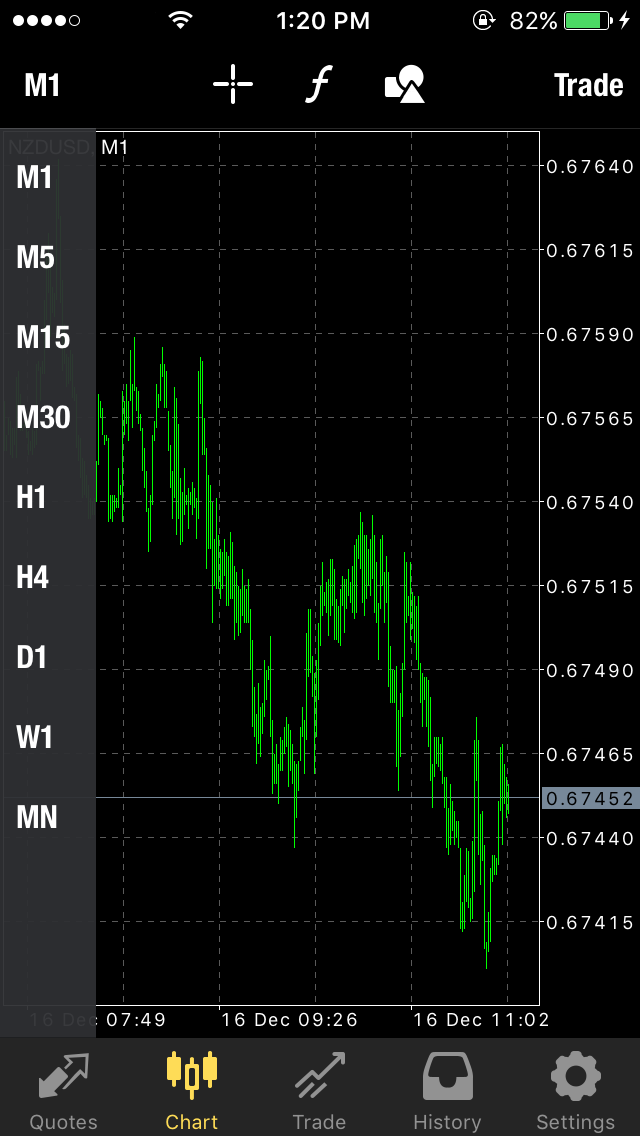
This article explains the different icons on "Chart" section.
The first icon on the left indicates the time frame where you can choose your desired one.
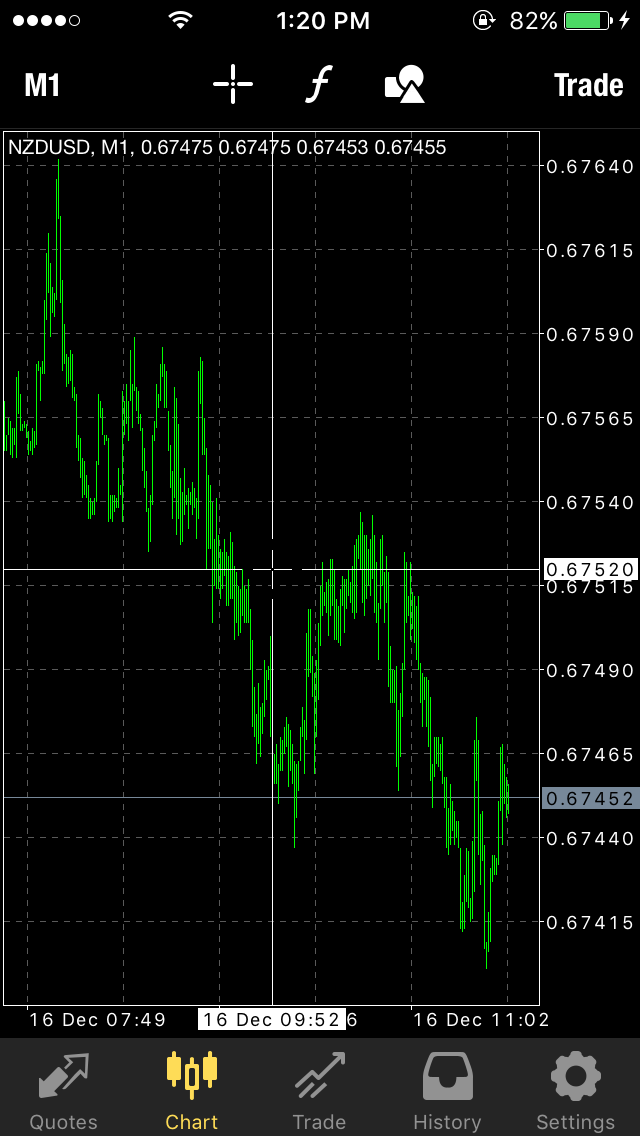
The shown icon represents objects. Select the icon and on the next page you can choose the "Add Object" for more options.
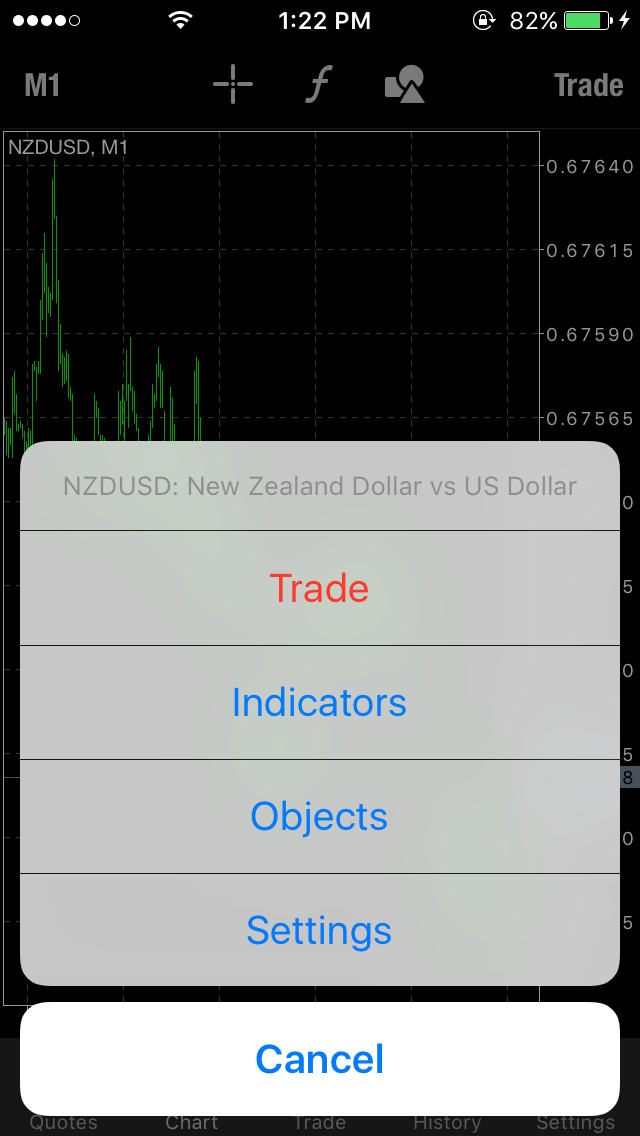
Then you can select your desired option. You can also open positions through the same page using the
You may access all these features by a single tap on the chart page:
The "Settings" part gives you the ability to choose your chart type and other features.
In case you don't find the answer for a question that interests you in this section or in the Knowledgebase, please contact the Client support department via live chat or request for a callback. | |
|
|
.PNG)
.png)
.png)
.png)
.png)
.png)
.PNG)