|
Charts Toolbar
Charts are valuable instruments for analyzing the financial markets. That is why a great attention is paid to them. Chart toolbar is located on the top of your terminal. In order to make this option visible, go to the “View” menu, then click on the “Toolbars” from drop down list and mark “Charts” option.
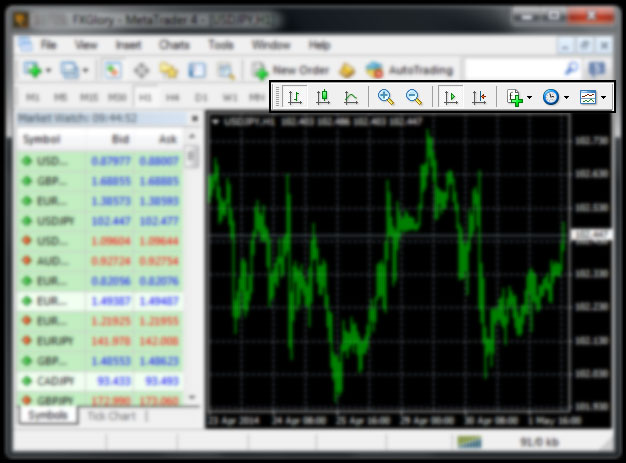
Chart types:
A symbol chart can be three types:
- Bar Chart — Display the chart as a sequence of “bars”.
Execution of this command is the same as pressing of the  button of the "Charts" toolbar or using the shortcut keys <Alt+1>. button of the "Charts" toolbar or using the shortcut keys <Alt+1>.
- Candlesticks — Display the chart as a sequence of "Candlesticks".
Execution of this command is the same as pressing of the  button of the "Charts" toolbar or using the shortcut keys <Alt+2>. button of the "Charts" toolbar or using the shortcut keys <Alt+2>.
- Line Chart — Displays the chart as a broken line connecting close prices of bars.
Execution of this command is the same as pressing of the  button of the "Charts" toolbar or using the shortcut keys <Alt+3>. button of the "Charts" toolbar or using the shortcut keys <Alt+3>.
The same action can be performed by pressing of the "+" key or the  button of the "Charts" toolbar. button of the "Charts" toolbar.
The same action can be performed by pressing of the "-" key or the  button of the "Charts" toolbar. button of the "Charts" toolbar.
- Auto Scroll — If this option is enabled, the last bar will always be shown in the chart.
Execution of this command is the same as pressing of the  button of the "Charts" toolbar. button of the "Charts" toolbar.
- Chart Shift — Shift the chart from the left window border to the shift label of the chart. The shift label of the chart (a grey triangle in the upper part of the window) can be moved with the mouse horizontally within 10 to 50% of the window size.
Execution of this command is the same as pressing of the  button of the "Charts" toolbar. button of the "Charts" toolbar.
- Indicators — Indicator is a mathematical manipulation with price and/or volumes of a security in order to forecast future price changes. Decisions about how and when to open or close a position are made on basis of signals from technical indicators. Indicators can be imposed into a chart by pressing of the
 button of the charts toolbar. button of the charts toolbar.
-
Period Change — The client terminal allows to use nine different data periods, from a minute to a month long. This variety of periods is necessary for analyzing the market with technical indicators and line studies. The desired period of the chart can be chosen with help of the "Periods”  icon of the "Charts" toolbar. icon of the "Charts" toolbar.
Template — Call the template managing sub-menu. 
From this sub-menu, one can impose any template into the active chart. Moreover, a new template can be stored based on the active chart, or an existing one can be deleted.
In case you don't find the answer for a question that interests you in this section or in the Knowledgebase, please contact the Client support department via live chat or request for a callback.
| 