Live Chat Software by Kayako |
|
How to read charts in MetaTrader 4?
Posted by on 06 June 2014 04:09 PM
|
|
|
How to read charts in MetaTrader 4?
To become a successful Forex trader and to make a profit, you must know how to read charts which are very important and essential factors for any traders. The charts can be placed into three different categories:
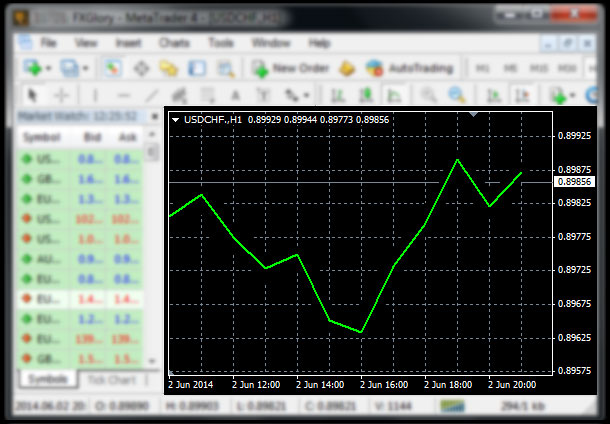
1. Line Bar Chart - is the easiest way to read charts. It simply shows a line graph of time vs. price. A basic price chart in which there are no ticks, just a line indicating the last price for that chart period.
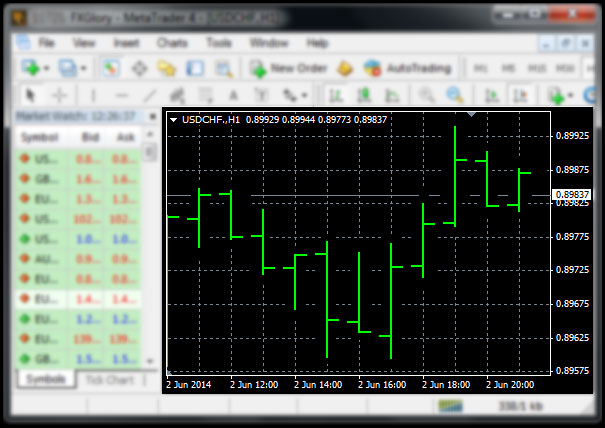
2. Bar Charts- shows the entry price per period, the exit price at the end of the period and the high and low of that period.
Each tick on the chart provides the price at open, highest price, lowest price, and last or close price for a given time period (as well as candlesticks graphs).
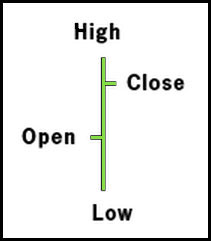
- High - The top point of the vertical bar. - Low - The bottom point of the vertical bar. - Opening Price - A small horizontal line to the left of the vertical bar. - Closing Price - A small horizontal line to the right of the vertical bar.
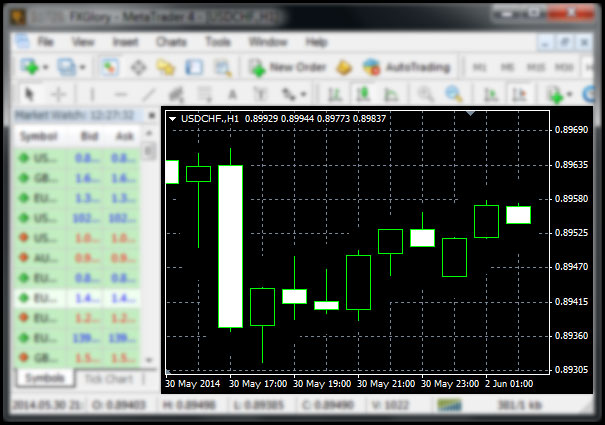
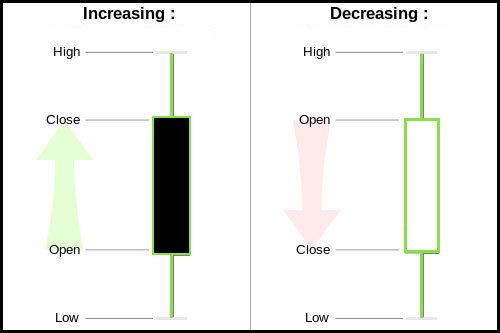
3. Candlesticks- are graphical representations of price fluctuations for currency pairs.
It is a combination of a line-chart and a bar-chart, in that each bar represents the range of price movement over a given time interval. It is most often used in technical analysis of equity and currency price patterns. As it is shown in the picture below, the hollow (black) bars are the bars that have moved up. Coloured or filled (white) bars are the bars that have gone down. The lines that you see above each bar represent the high and low shadows.
In case you don't find the answer for a question that interests you in this section or in the Knowledgebase, please contact the Client support department via live chat or request for a callback. | |
|
|